Linear regression part one - linear quadratic loss minimizer.
If there is one thing statisticians are good at, it is drawing straight lines. (Peter Mueller deserves the credit for that – he said it in a lecture once.)
I write this partly to get the blog up and running, and partly because it’s good to begin at the beginning.
Suppose you have a graph that looks like this:
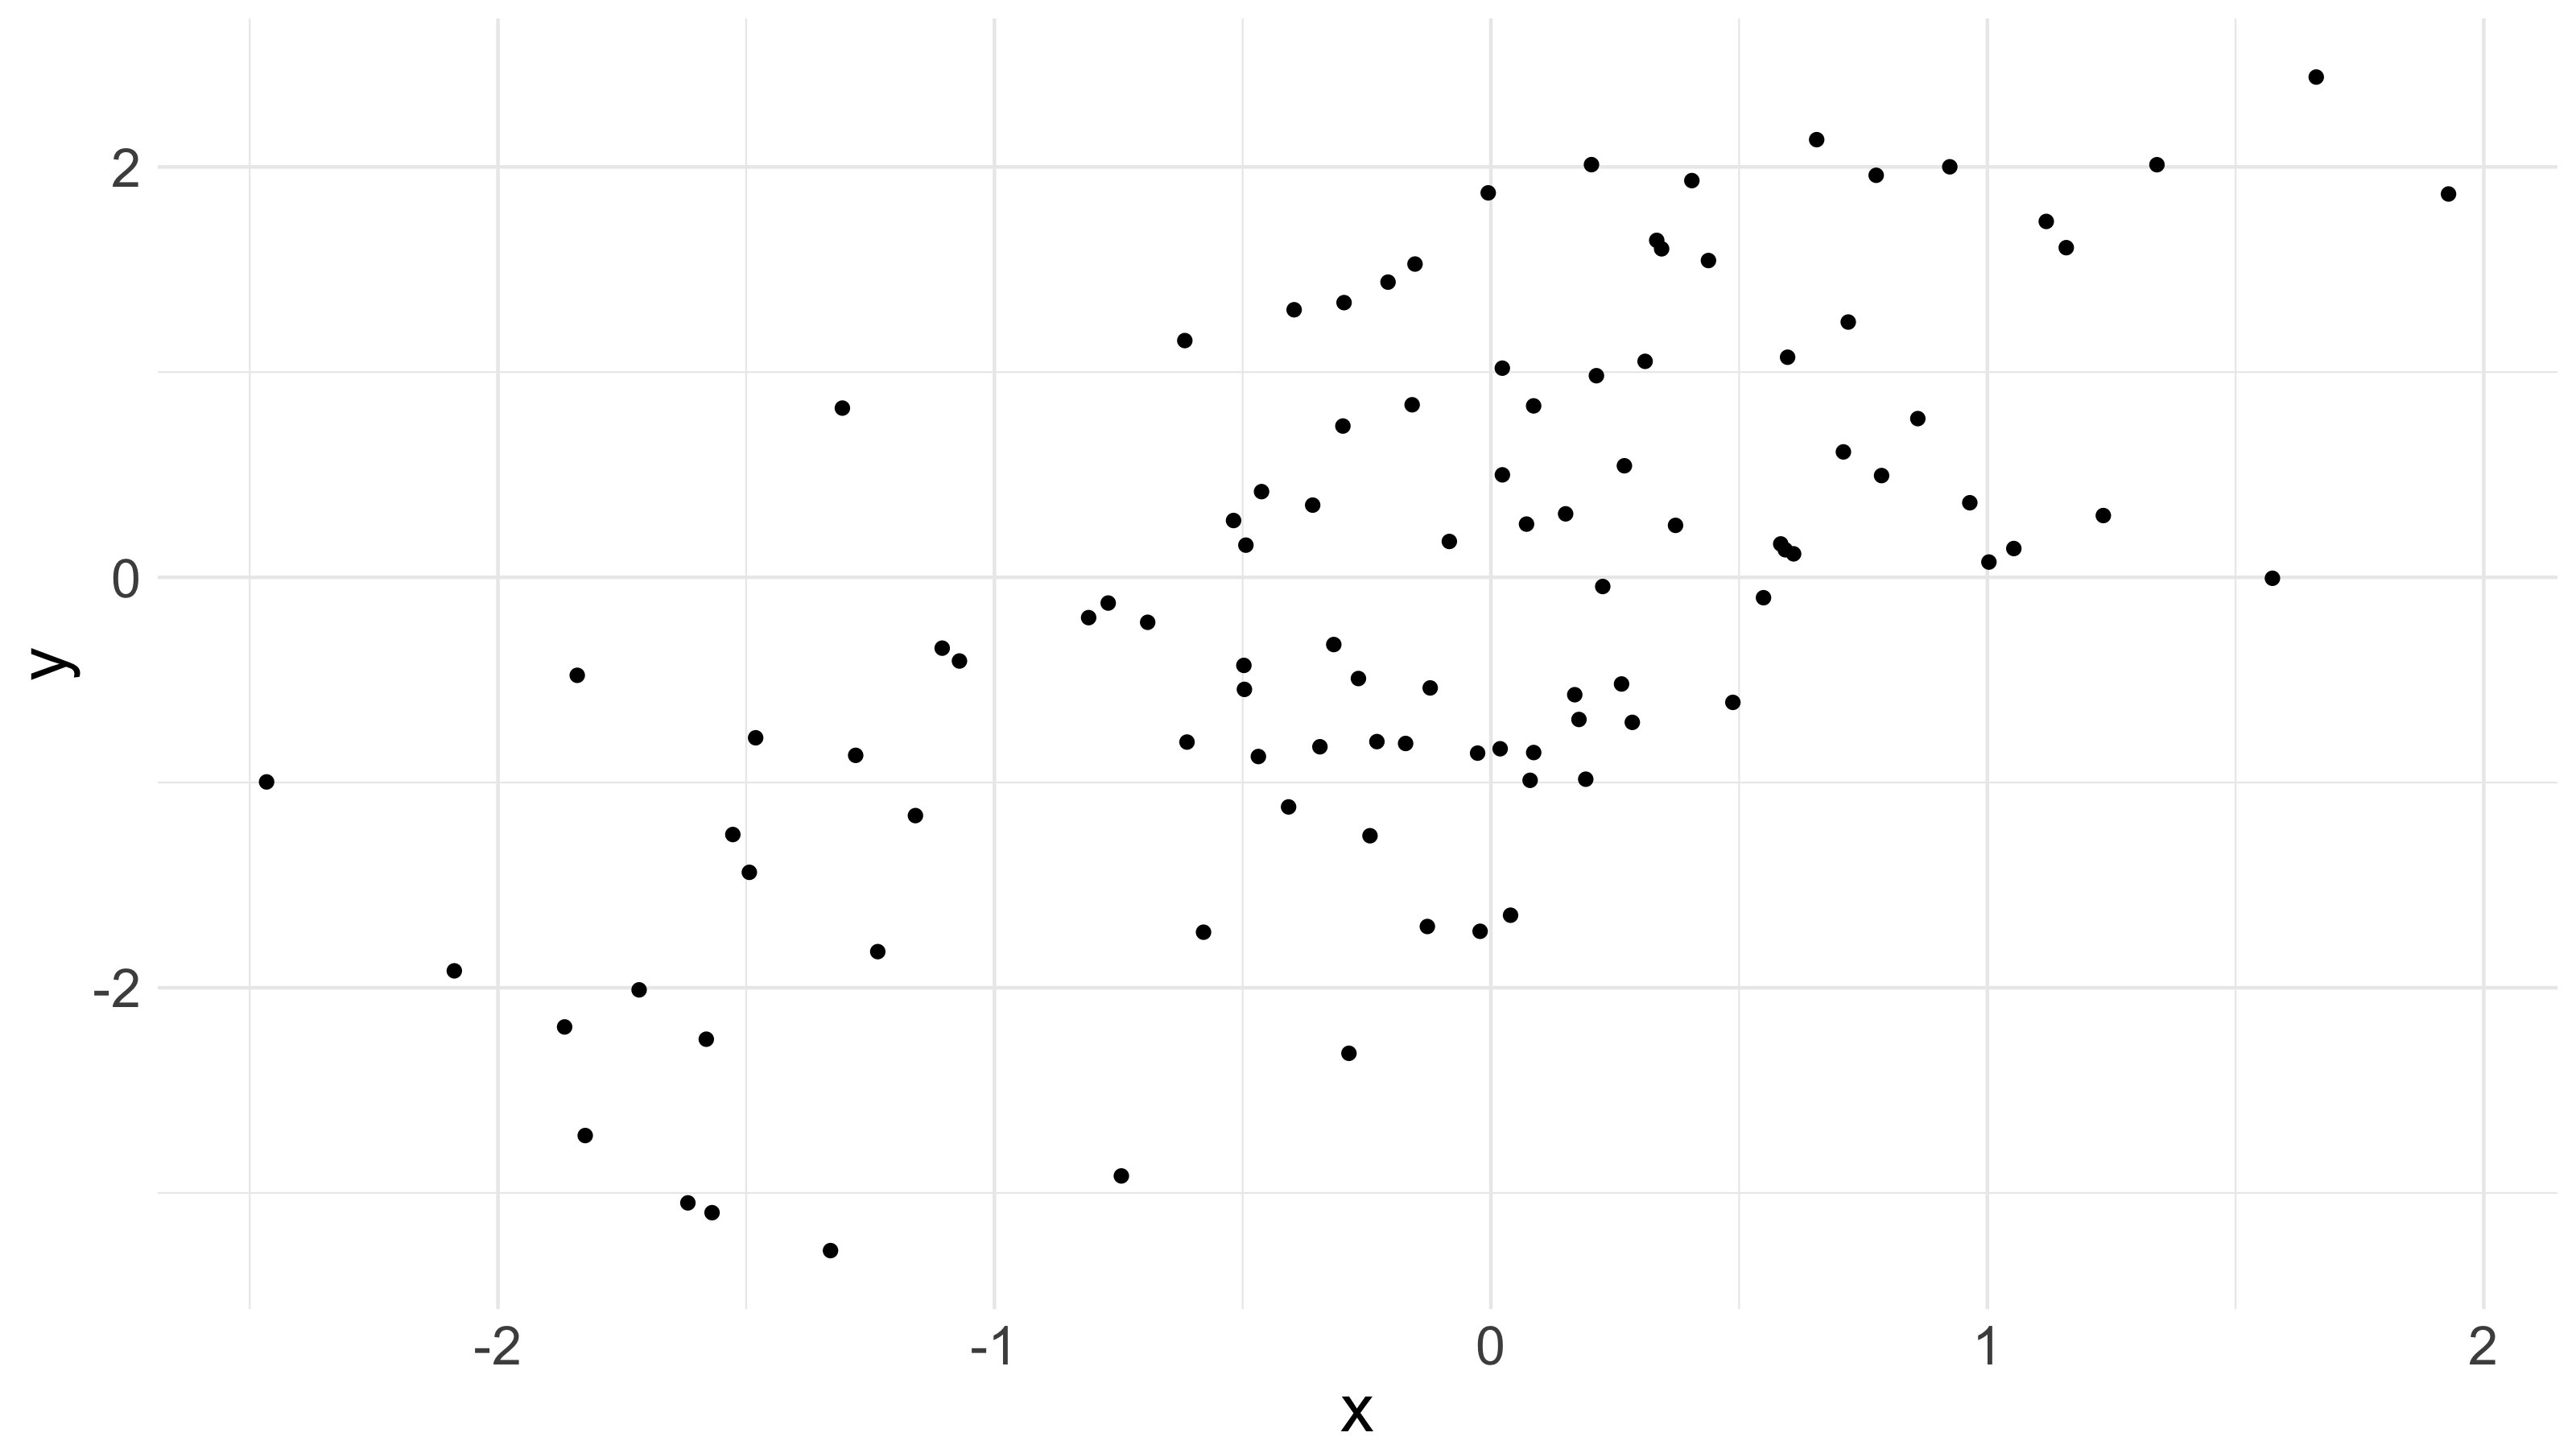 And suppose you wanted to capture the data on that graph, as well as possible, using a linear function of – i.e., something of the form . You might imagine that you would like a friend, who has access to all of the values of the points above, to recover the corresponding values, but that you only have enough bandwidth to transmit a slope and an intercept.
Now, suppose further that the cost you pay for any error in your friend’s estimate is proportional to the squared error between her guess - based on the slope and intercept you provided – and the true value.
In that situation, the “best” line is the one that minimizes quadratic loss – the sum of the squared vertical distances between each point and the line in question. So you want to find and which satisfy:
Equivalently, if we let
then the best line is the one that minimizes
To find that minimum, first notice that because is a scalar, and hence because ,
So, to find the which minimizes quadratic loss, take partials of that last, set them to zero, and solve:
The last step is kosher so long as is invertible.
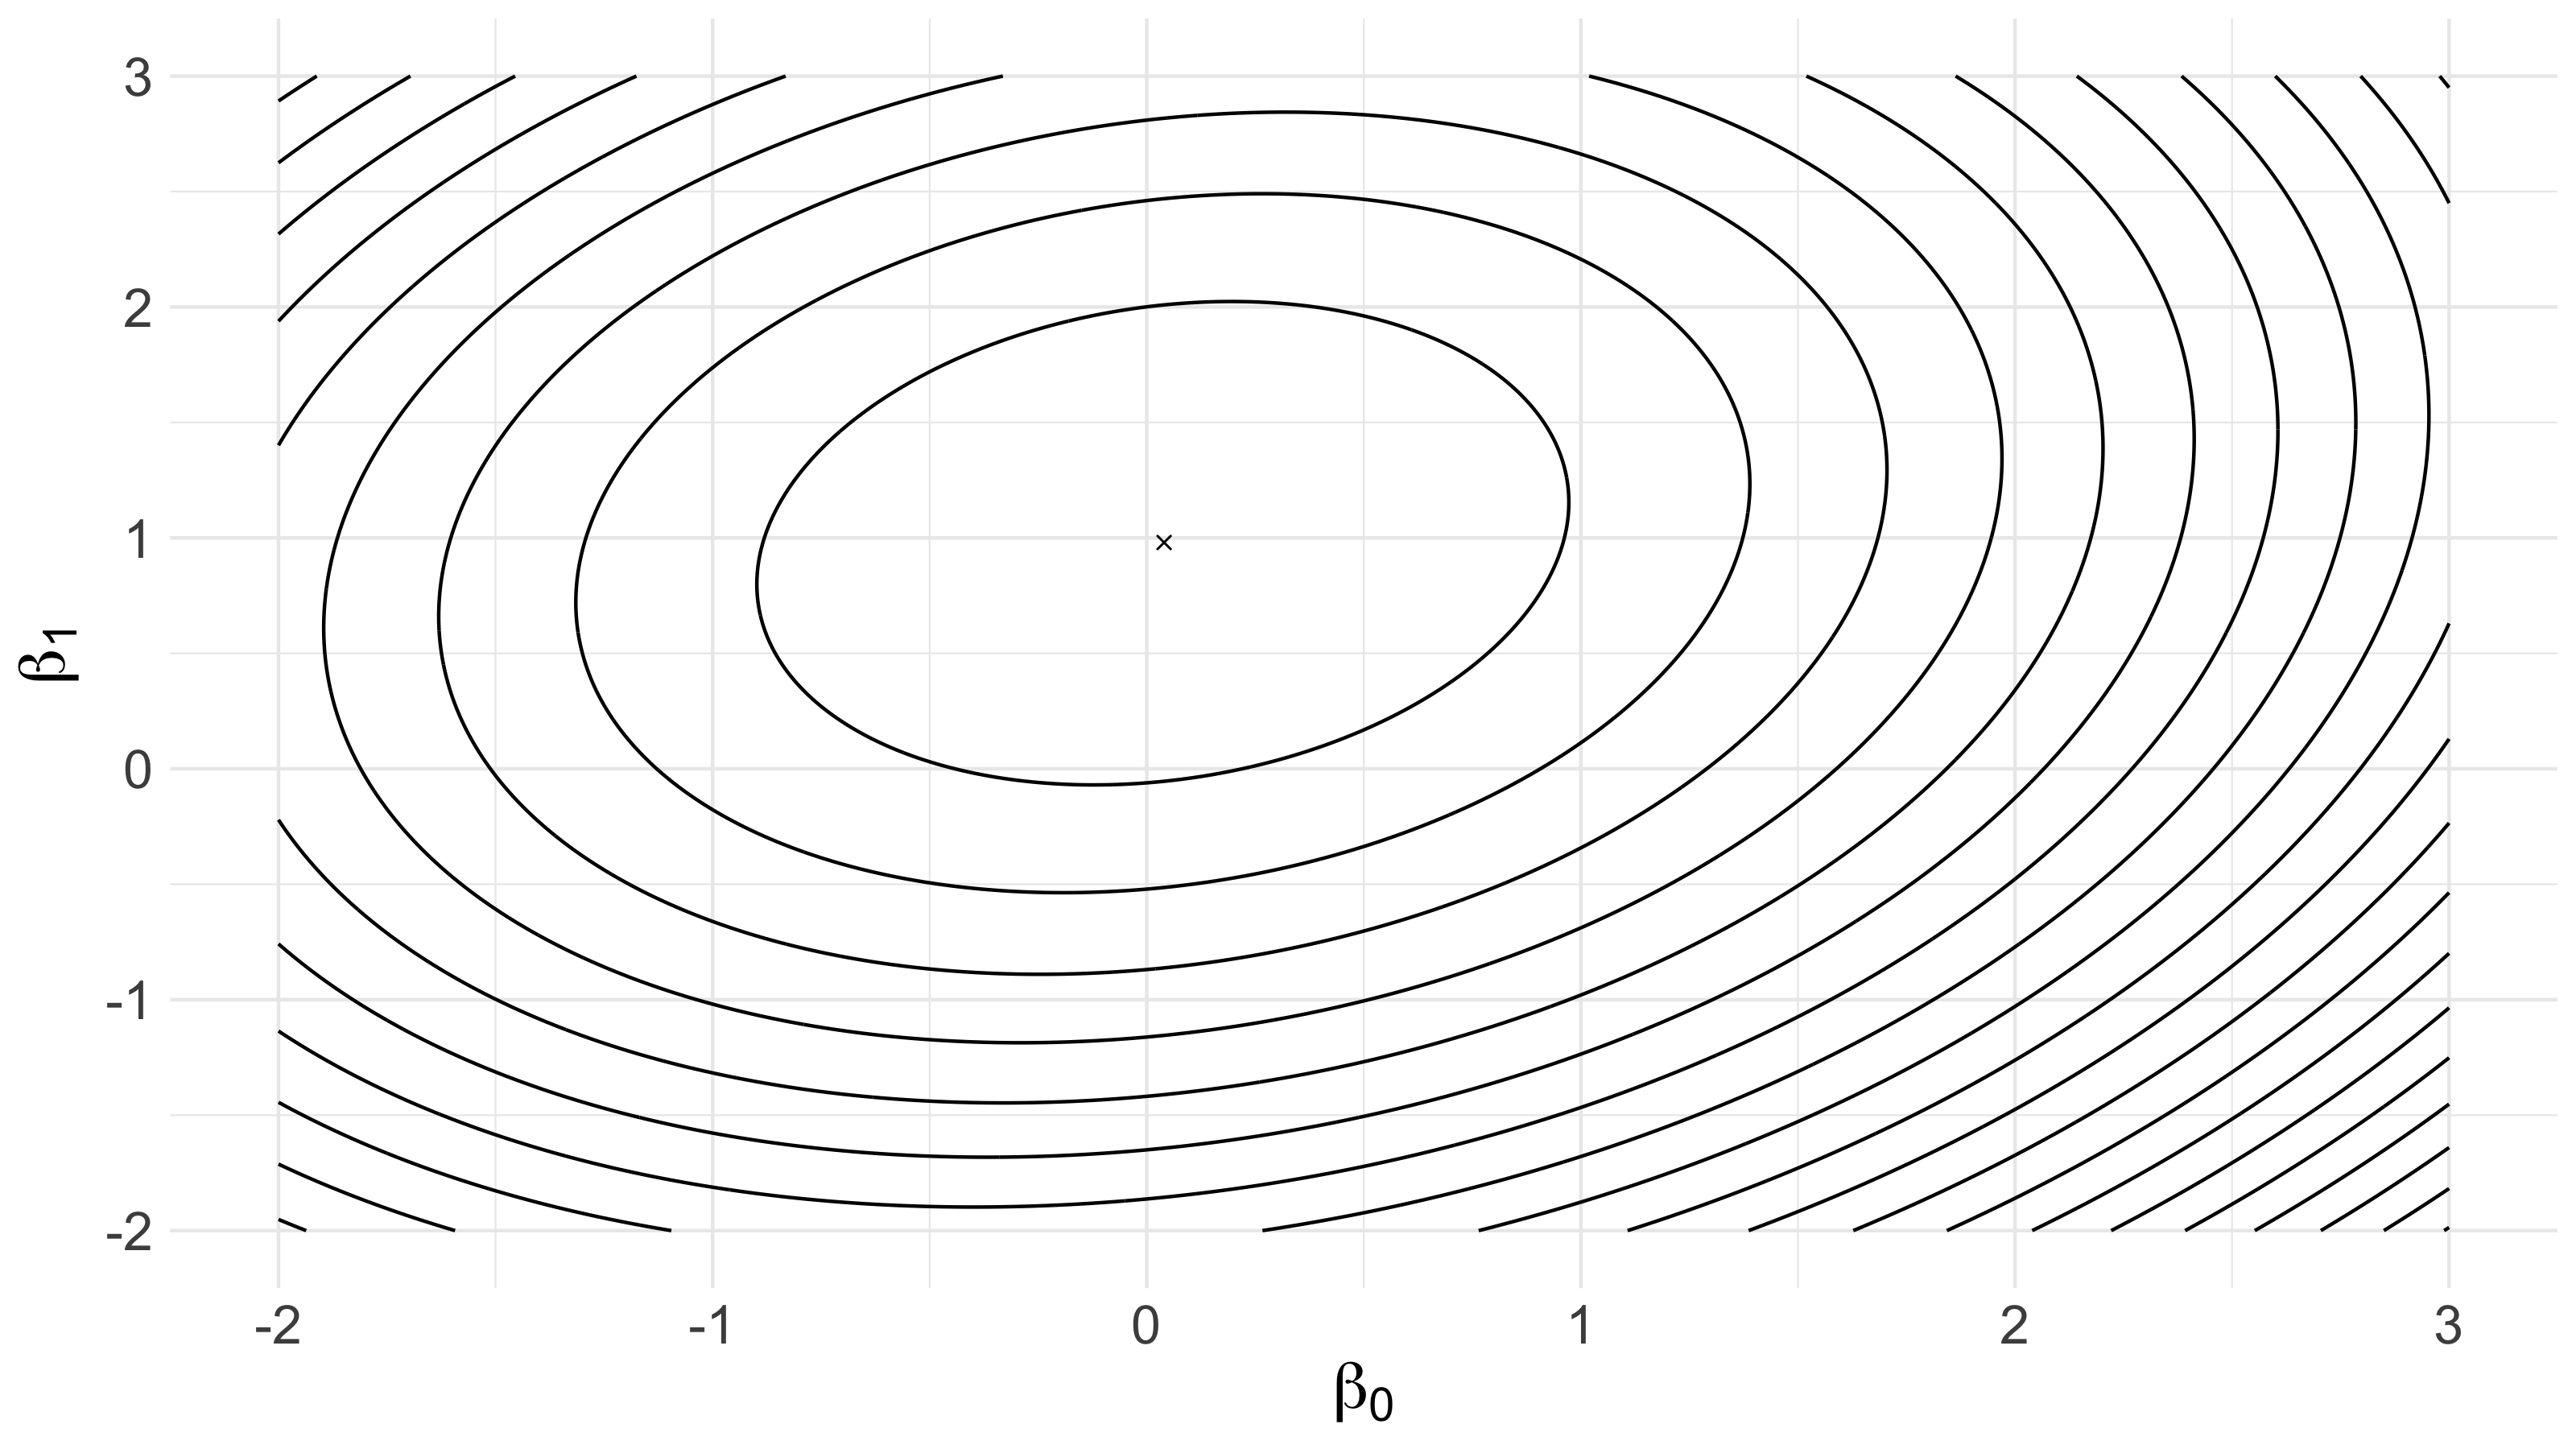
Regarding the data in the scatterplot above as fixed, the contour plot below shows the value of the quadratic loss function, for differing values of and . The tiny ‘x’ marks the unique minimum we just found, .
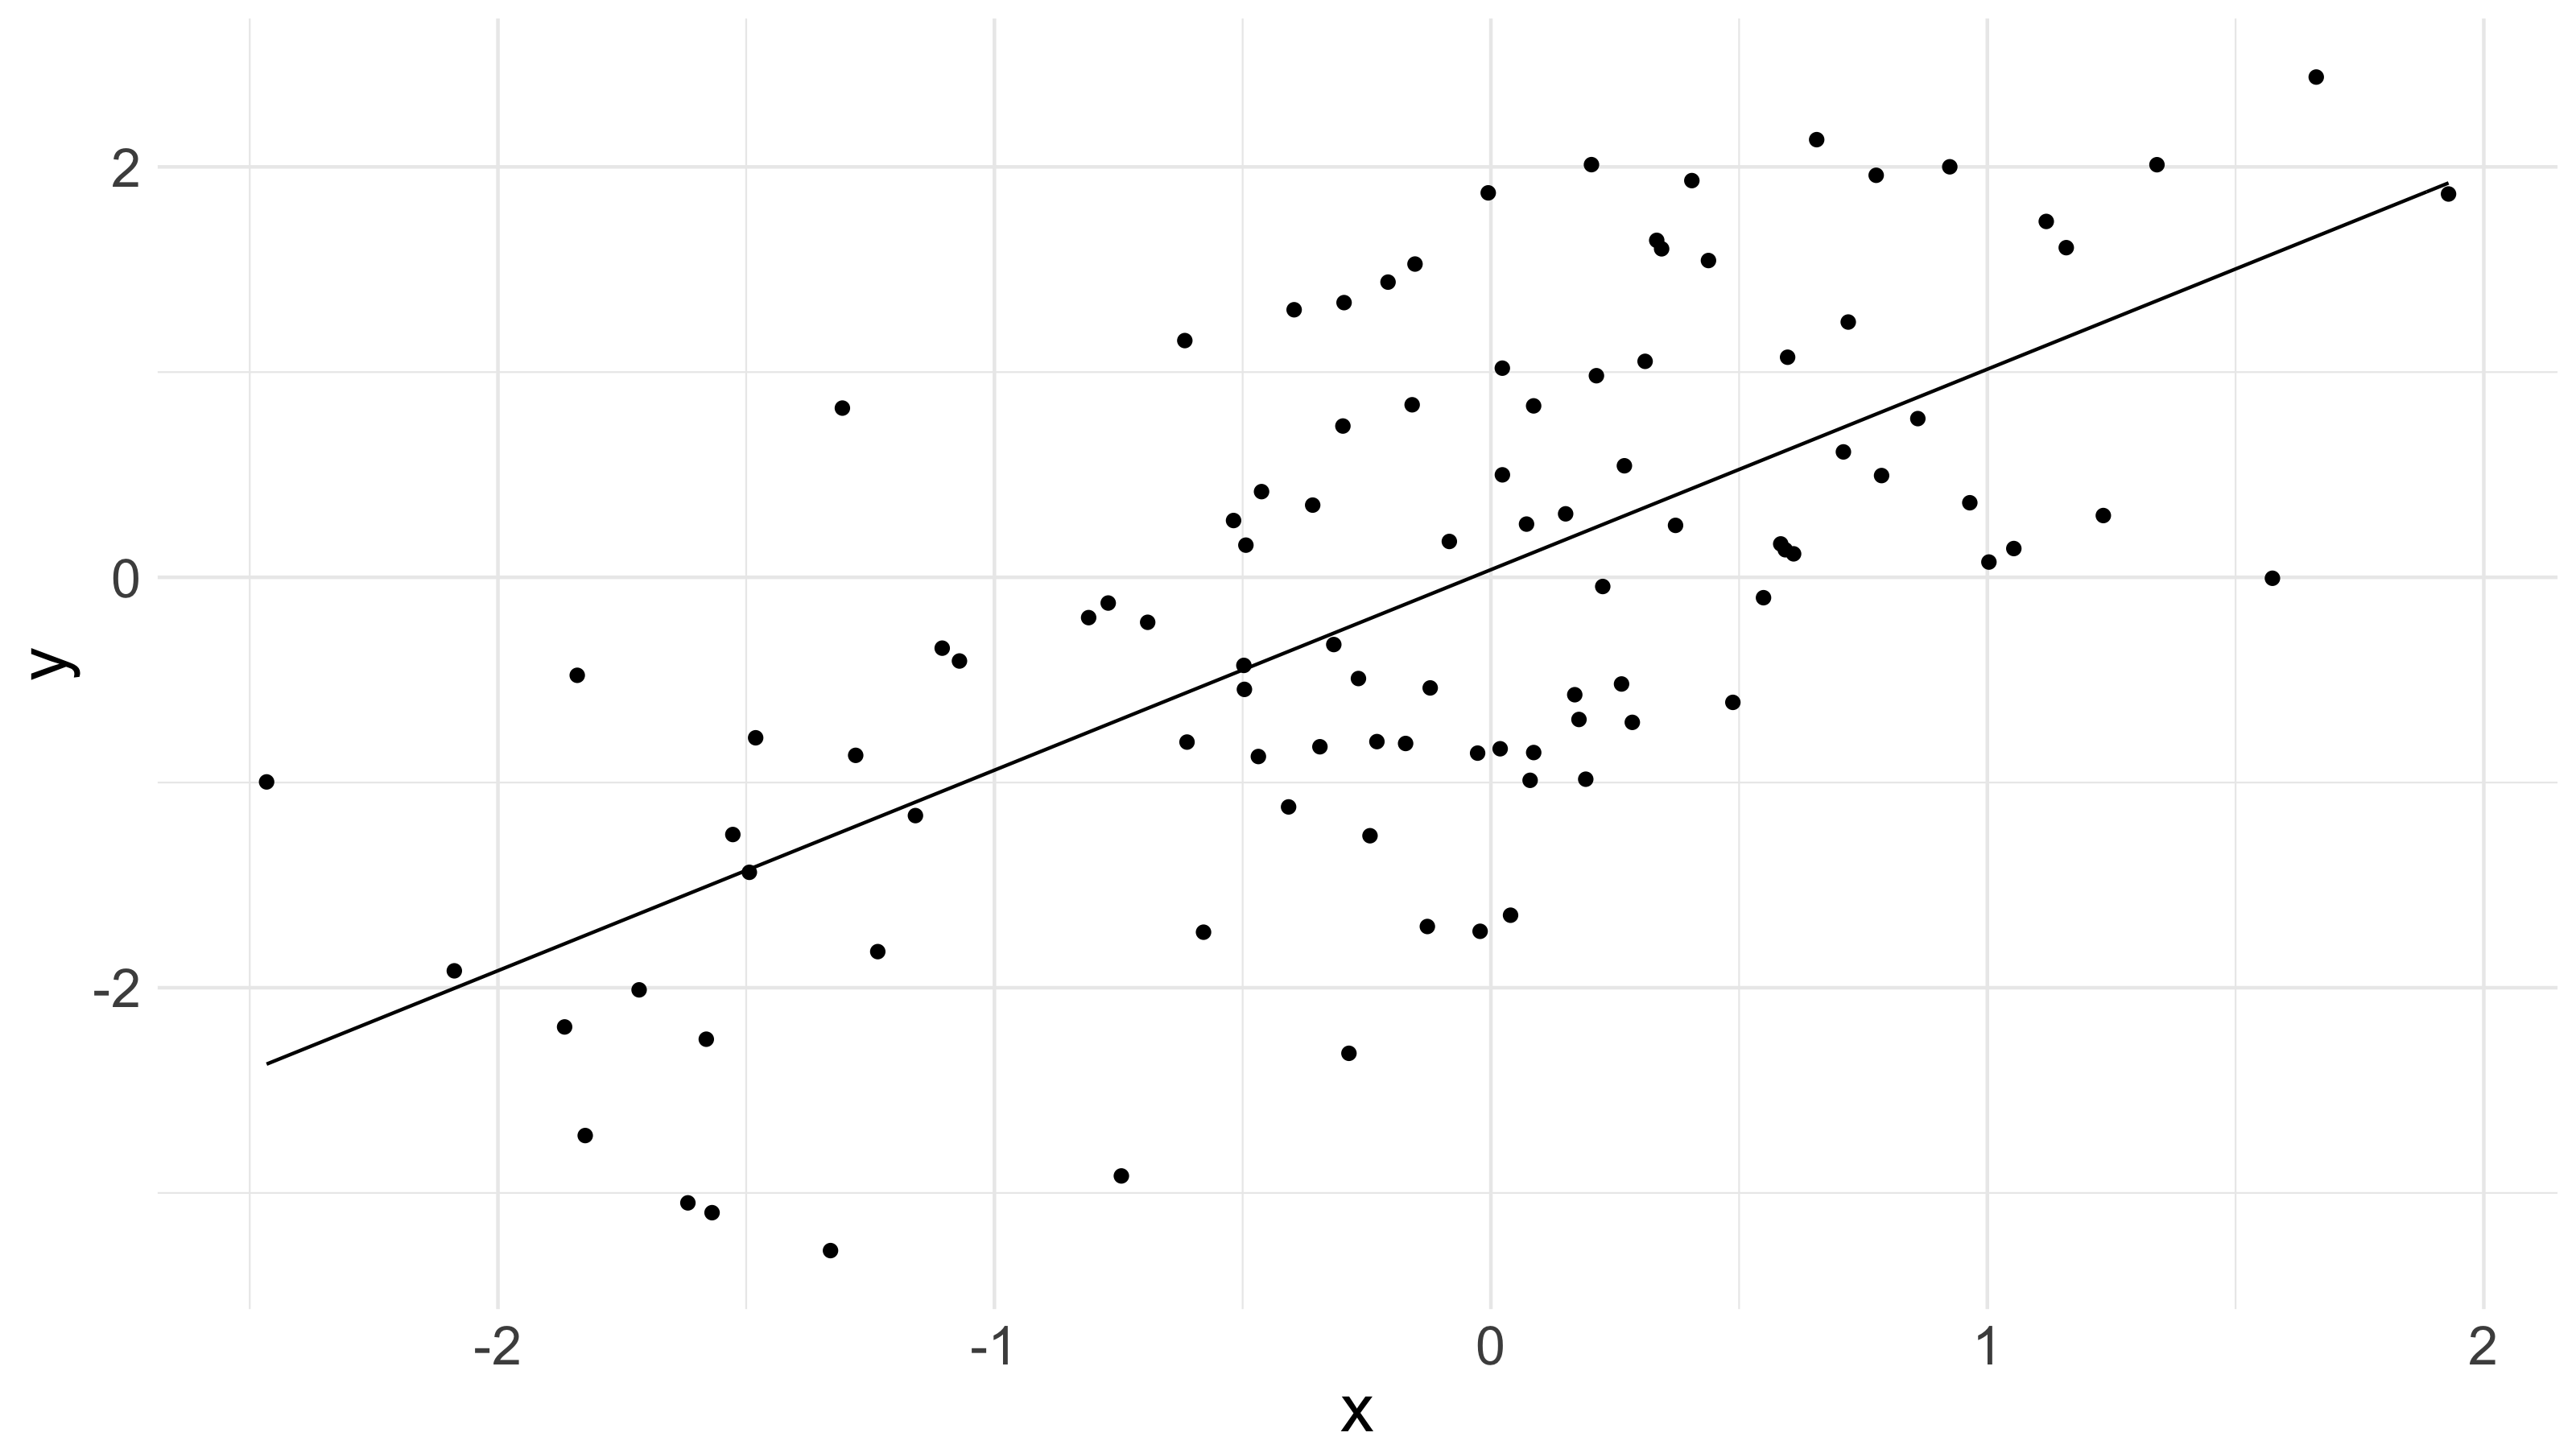
And the line through our points, which corresponds to that choice of and , is drawn in the below picture.
 Voila.
Notice there was nothing stochastic in anything above - no assumptions about a probability distribution governing or , or normally distributed epsilons or anything like that. If what you care about is quadratic loss, then gives you the best line through your points, probability distributions be damned.
Some R code below. Simulate some data, then find and plot the line which minimizes quadratic loss for that data.
require(ggplot2)

## Simulate some data. X[,2] ~ N(0, 1), Y ~ N(X[,2], 1).
X <- matrix(c(rep(1, 100), rnorm(100)), ncol = 2)
Y <- rnorm(100, mean = X[,2])

## Find (X'X)^(-1)X'Y.
beta_hat <- solve(t(X) %*% X) %*% t(X) %*% Y

## Plot the data, with the regression line.
df <- cbind.data.frame(x = X[,2], y = Y)
ggplot(df, aes(x = x, y = y)) +
  geom_point() +
  stat_function(fun = function(x){beta_hat[1] + beta_hat[2]*x}) +
  theme_minimal() +
  theme(text = element_text(size = 20))